
Following a few days of declining bond yields and mortgage rates this week, the trajectory took a significant turn on Friday with the release of favorable labor data, sparking a notable increase in the 10-year yield, a key indicator for those in housing.
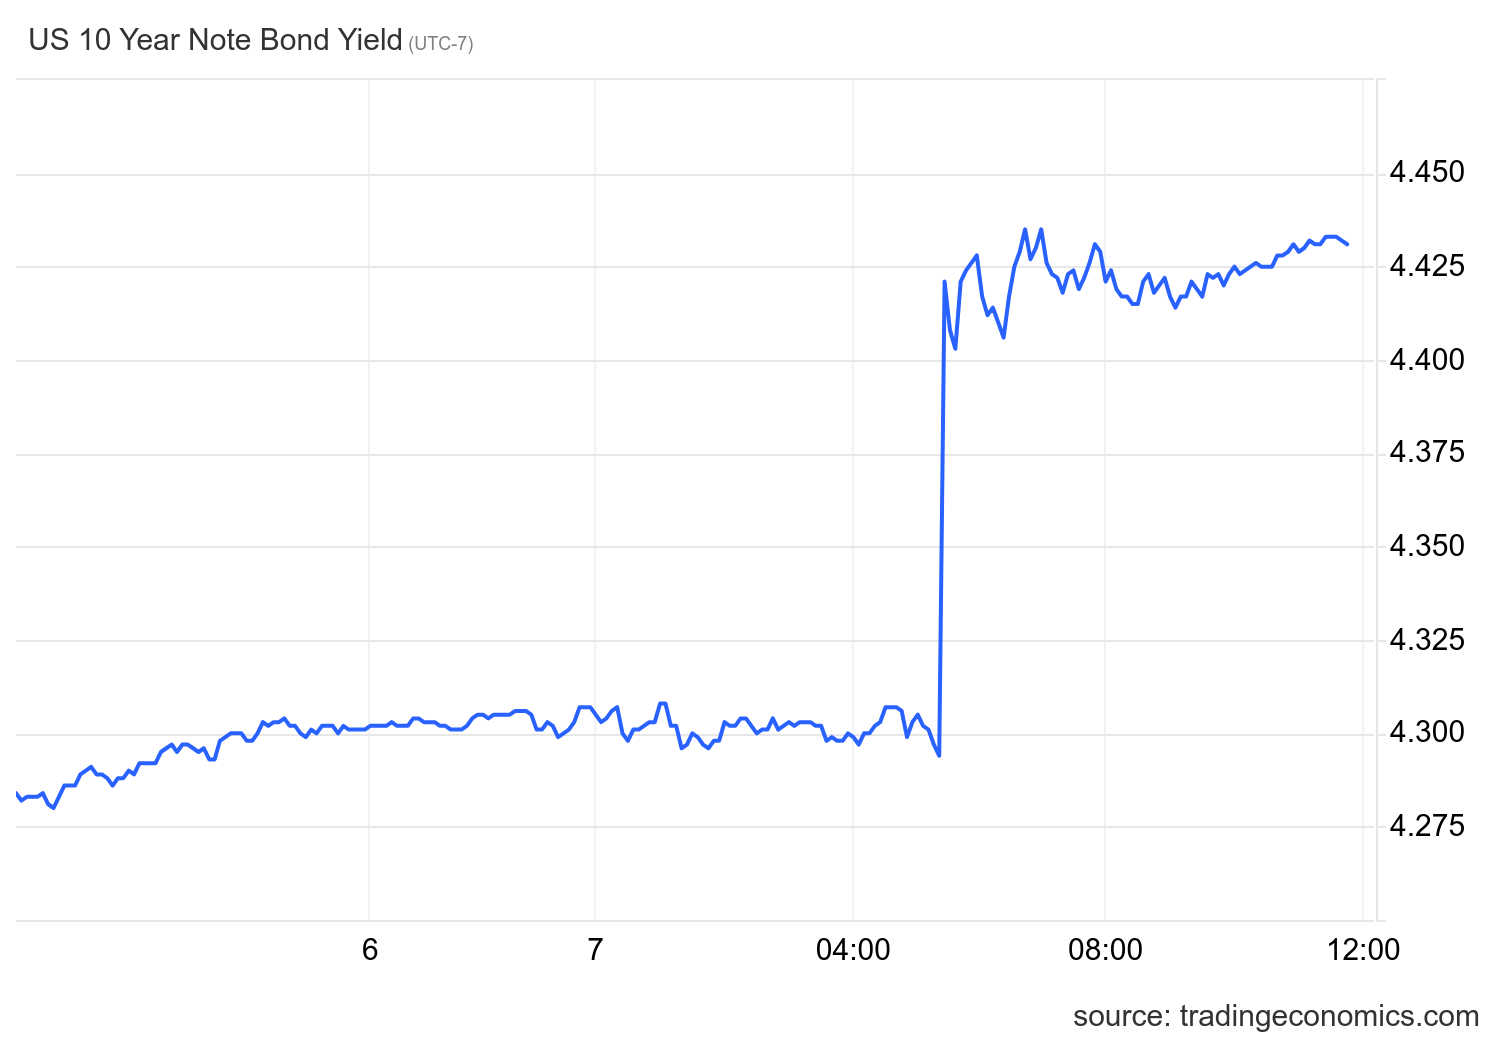
The BLS jobs report shows the honey badger labor market woke up and once again chose violence this morning. Not only did headline jobs beat estimates, but negative revisions were minor and wage growth picked up. This is obviously negative for mortgage rates, as bond yields were close to breaking a key technical level but reversed course.
Fortunately for the mortgage industry, the Federal Reserve focuses more on the underlying data it tracks rather than the headline BLS prints. In a recent meeting, when asked if robust headline job numbers would lead to a rate hike, Fed Chair Jay Powell responded that the growth rate of inflation fell faster than anticipated, with the labor market printing big job numbers in 2023. This suggests that the Fed’s view of jobs week is more nuanced and that one jobs report is not the sole basis for their decisions. Let’s review what the Fed is looking at.
Job openings data
The Fed loves job openings data as they cite it as their reason for the unbalanced labor supply premise. My working theory is that the Fed wants to see us drop to 7 million job openings — that’s when they will take a more dovish tone. We have come down from a record 12 million job openings after COVID to nearly 8 million. Softer labor data makes the Fed smile, but we’re not at the target yet.

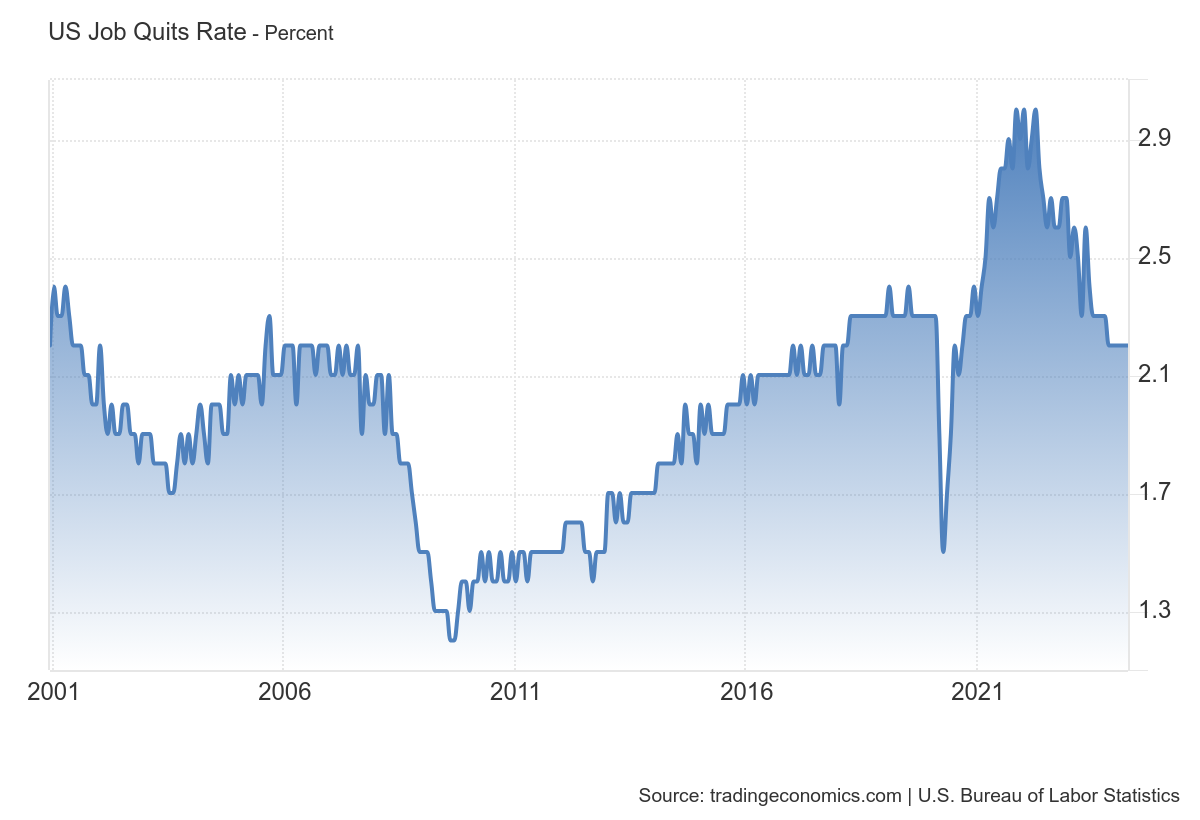
The quits ratio, my key data line to show whether the labor market is tight, is back to pre-COVID-19 levels. Based on what the Fed tracks, we are no longer in a tight labor market. However, I believe the 7 million number is their target level for job openings and when we get there it should drive the quit rate percentage to below 2%.
Jobless claims
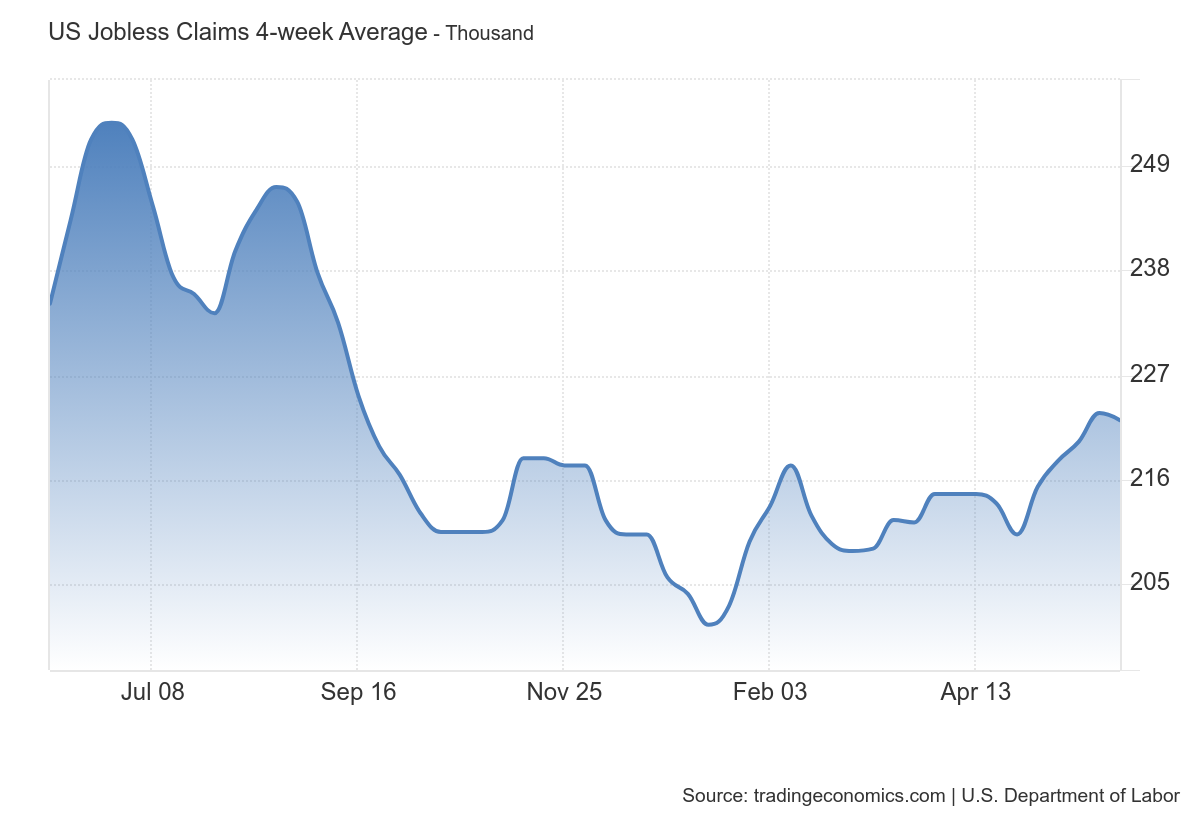
Jobless claims are the critical recession labor trigger for me. My recessionary target level is 323,000 on the four-week moving average. If the Fed waits to pivot even when we get close to this number or after we hit this number, the soft landing disappears. Just heading closer toward this number is a very bearish labor signal. Jobless claims are rising from the recent low but not enough to get the Fed’s attention and since Jay Powell said the Fed watches jobless claims data, it’s a key data line to track weekly. This week, we saw a mild decline but it’s trending higher from the recent lows.
BLS jobs Friday
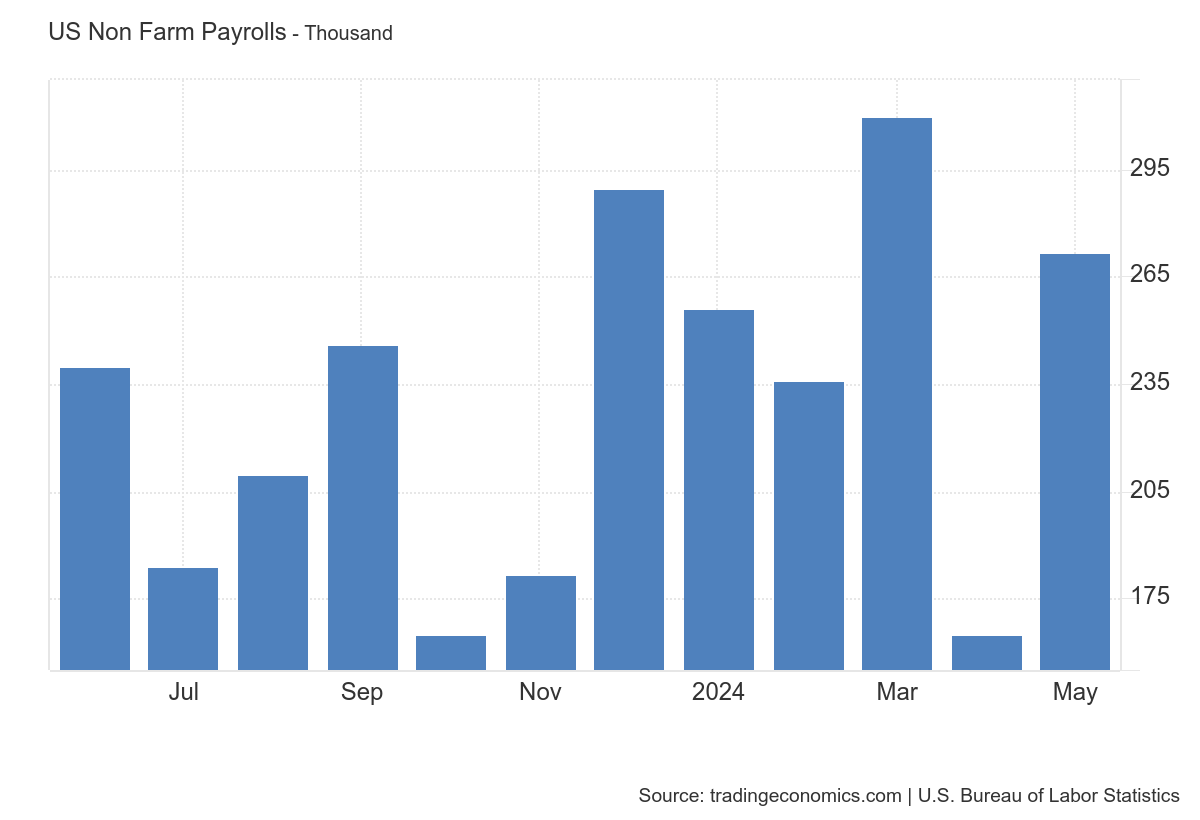
From BLS: Total nonfarm payroll employment increased by 272,000 in May, and the unemployment rate changed little at 4.0 percent, the U.S. Bureau of Labor Statistics reported today. Employment continued to trend up in several industries, led by health care; government; leisure and hospitality; and professional, scientific, and technical services.
Here is a breakdown of the jobs created this month:
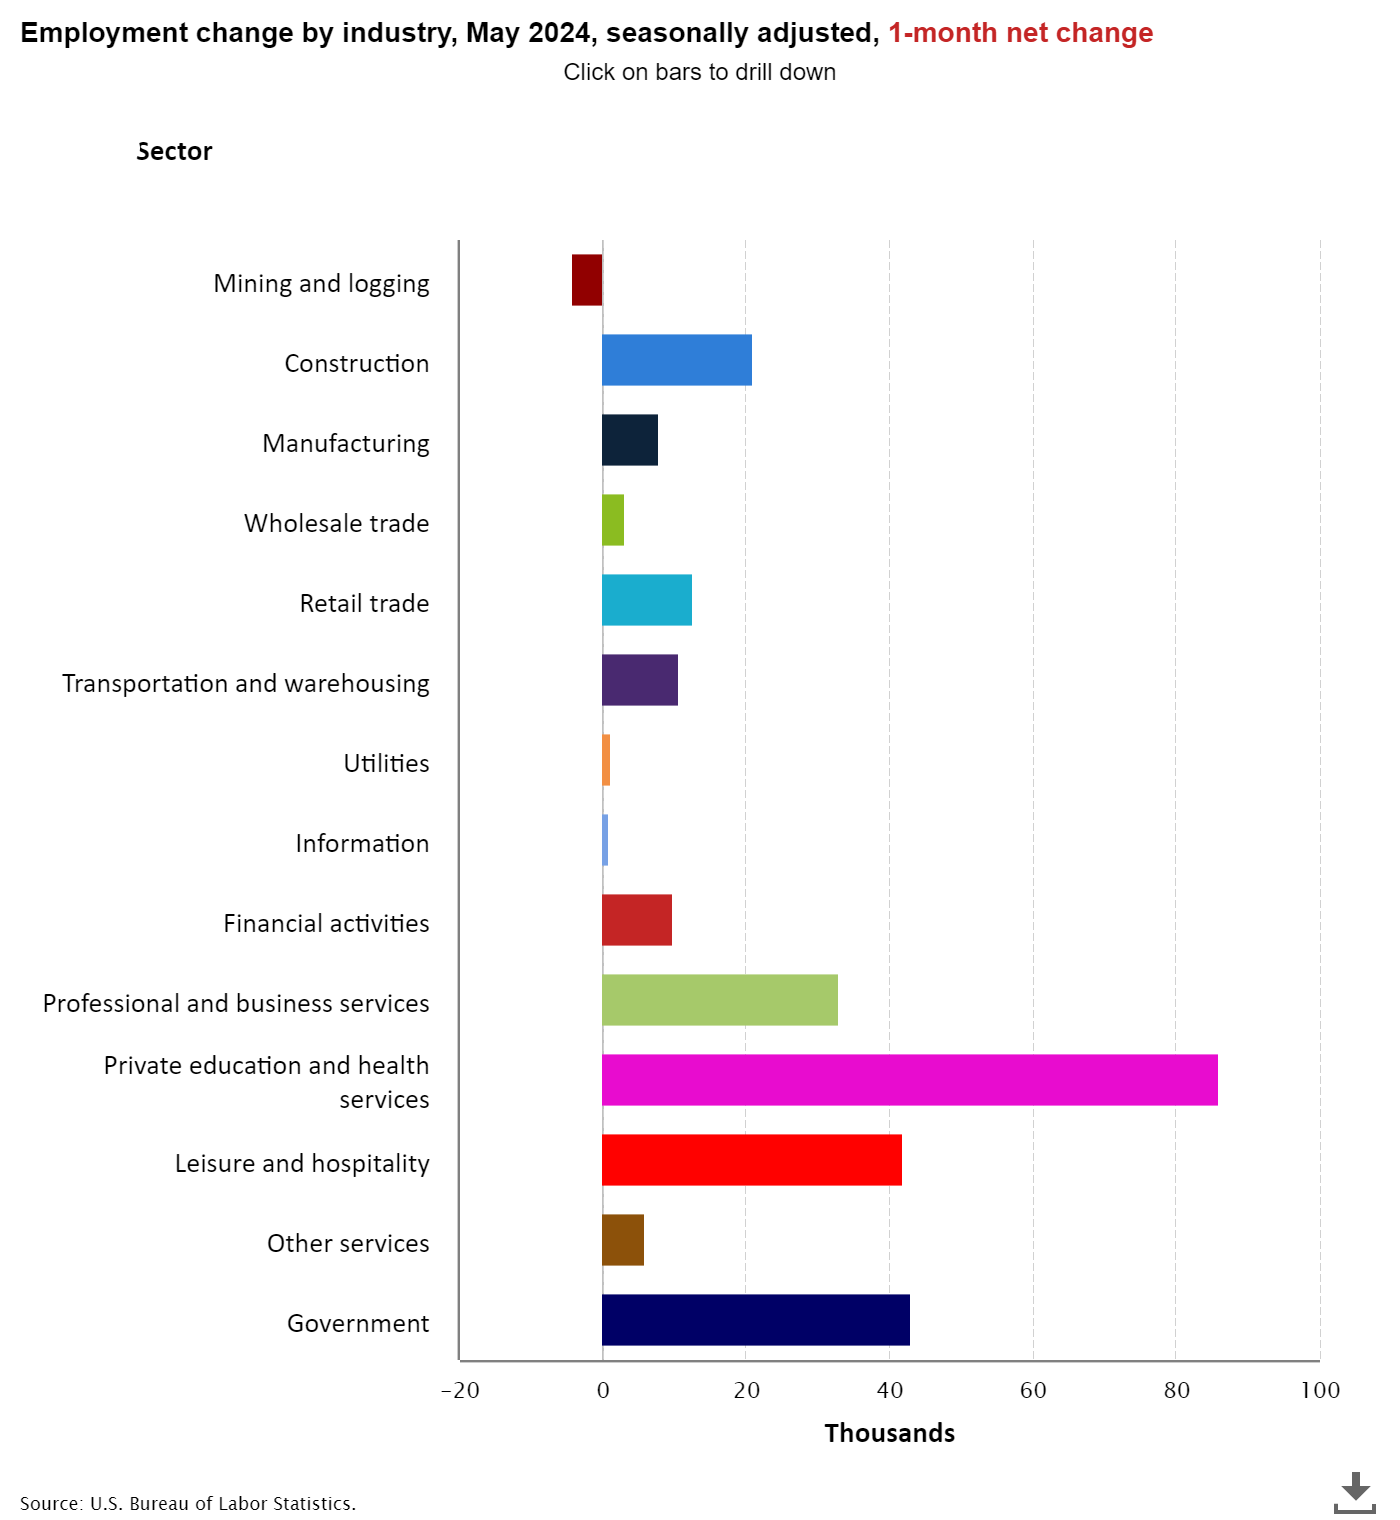
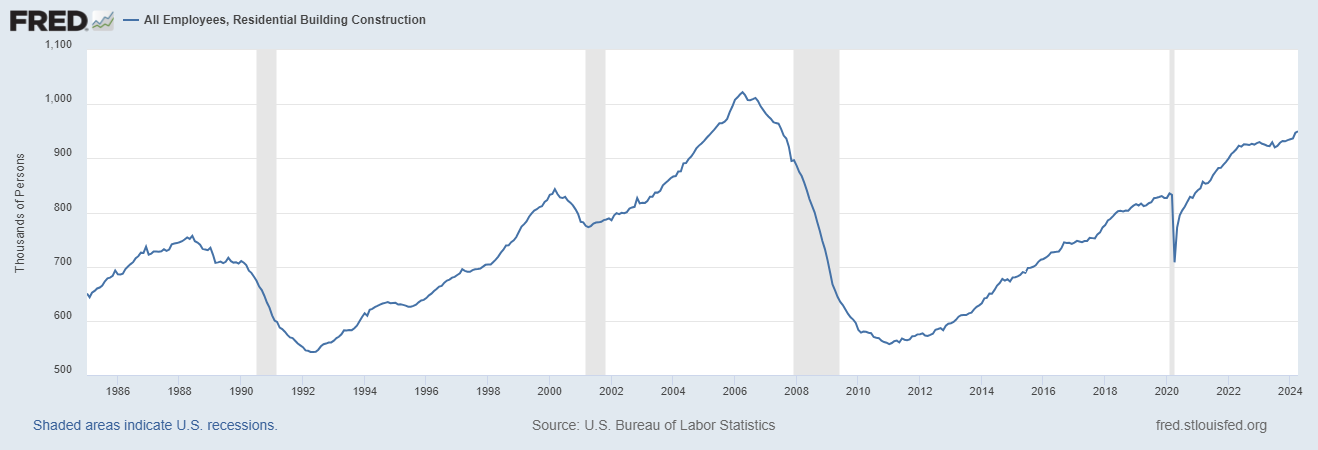
As always, one of the labor sectors I watch for a recession is residential construction workers, who tend to lose their jobs before the recession. So far, that hasn’t happened yet. Note: Don’t put all your eggs into the inverted yield curve basket without economic data looking recessionary. I believe this is the big mistake stock traders made for two years now.
Wage growth data is critical for me and my model for the Federal Reserve. I believe the Fed is targeting 3% wage growth because they don’t think the productivity numbers are as strong as they report. So, while wage growth is not spiraling out of control and has been cooling off since 2022, I believe we need to get below 3.5% to have the final countdown to 3% wage growth where the Fed no longer sounds hawkish.

This is the critical topic that I want to discuss. One of my labor market recovery calls has been based on the premise that if we hadn’t gone through COVID-19, there should be around 157 million to 159 million people working. As this economic cycle progresses and we get close to 159 million, job growth numbers should cool down. This means we should be trending between 140K and 165K per month as we get closer to 159 million people employed. So far, this call isn’t looking good as we are currently at 158,543,000 total nonfarm payrolls, and the last thre-months’ average is 249,000.
However, I do expect the headline jobs data to slow. Because that data line should slow, the unemployment rate should be ticking up over the next 12 months. Keeping the unemployment rate lower will be more complex and more challenging unless we are pushing 250K jobs per month. This is something to consider for the rest of this year and 2025.
Overall, the headline jobs print beat estimates and wage growth was a bit stronger than anticipated, but jobs week data is still showing me what I have been seeing for months now: a labor market getting softer but not breaking yet. For mortgage rates, the labor data has always been critical because I believe once we get labor data breaking, the bond market will do a lot of early heavy lifting for the Fed, and they won’t mind mortgage rates going lower.