
Relitix’s latest release of the Agent Movement Index (AMI) for April 2024 reveals a surprising shift in the dynamics of real estate agents, indicating potential changes in market conditions and strategies among brokerages.
Key Highlights from April 2024 AMI:
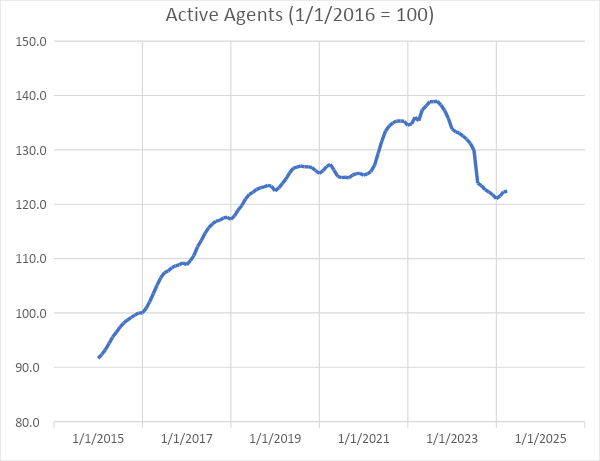
Rise in Active Agents: The data show an unexpected increase in the number of active real estate agents. This development is contrary to the declining trend observed in recent months, suggesting a potential revitalization in the industry.
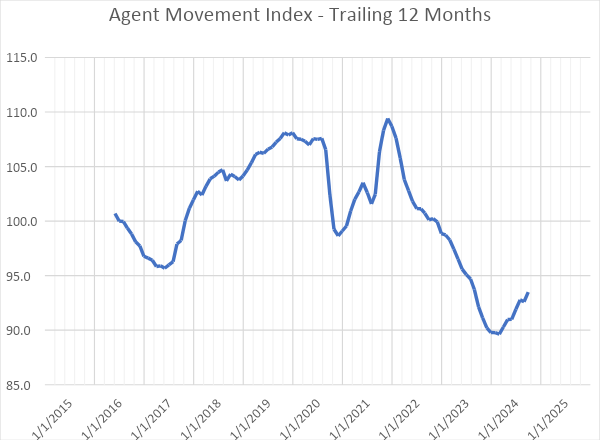
Continued Increase in Agent Mobility: A significant trend is the continued rise in agents moving between brokerages. The propensity for agents to move has been increasing since early fall of 2023.
April outpaced March in Movement: March is usually the peak movement month for agents. There are only a few other years where Apil saw more movement than March. Both recent examples (2018, 2019) were high-movement years.
Rob Keefe, Founder of Relitix, commented on these findings, stating, “April’s data highlight a fascinating turnaround in agent activity and movement. The increase in active agents, paired with their mobility between brokerages, signals a potentially more robust market ahead. We remain vigilant in monitoring how the NAR settlement will shape the future of our industry.”
The AMI is a robust metric that tracks agent movement dynamics using extensive national data from major MLS systems. It is released monthly and includes both raw monthly figures and seasonally adjusted data to provide a transparent view of underlying trends.
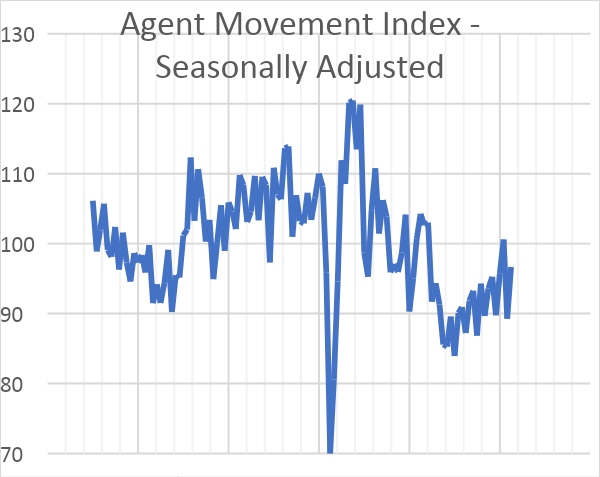
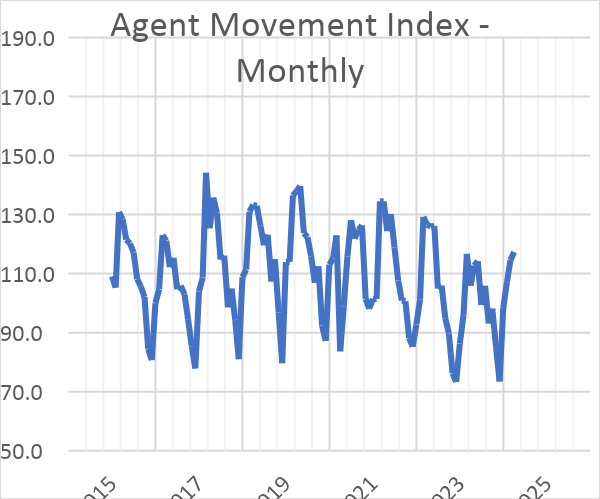
April’s report saw the AMI reaching a score of 117.3, with the seasonally adjusted figure slightly higher at 122.4, reflecting significant shifts and potential opportunities in the real estate landscape.
Trends in the relative movement of experienced real estate agents between brokerages are an important strategic consideration for brokerage and franchise leaders. The relative amount of movement fluctuates over time on a seasonal and long-term basis. To capture these trends and report them to the industry Relitix is proud to introduce its Agent Movement Index. The AMI is published monthly and features monthly and seasonally adjusted, and 12-trailing-month values. The index is calculated using national-level data from a large sample of the nation’s most prominent MLS systems.
About the agent movement index: The agent movement reflects the relative mobility of experienced agents between brokerages. The score is computed by estimating the number of agents who changed brokerages in a given month. To be counted the agent must be a member of one of the analyzed MLS’s and change to a substantially different office name at a different address. M&A-driven activity and reflags are excluded as are new agents and agents who leave real estate. Efforts are made to exclude out of market agents and those which are MLS system artifacts. The number of agents changing offices is divided by the number of agents active in the past 12 months in the analyzed market areas. This percentage is normalized to reflect a value of 100 at the level of movement in January 2016 (0.7313%). The seasonally adjusted value divides the monthly result by the average of the same month in prior years.
Analyzed MLS’s represent over 800,000 members and include: ACTRIS, ARMLS, BAREIS, BeachesMLS, BrightMLS, Canopy, Charleston Trident, CRMLS, GAMLS, GlobalMLS, HAR, LVAR, Metrolist, MLSListings, MLSNow, MLSPIN, MRED, Northstar, NTREIS, NWMLS, OneKey, RealComp, REColorado, SEF, Stellar, Triad, Triangle, and UtahRealEstate.
About Relitix: Relitix provides data-driven decision support for brokerage leaders across the United States. A pioneer in applying AI and data science technology in brokerage management, Relitix profiles over 1.2 million agents in more than 130 markets nationwide to help brokers recruit, coach, and retain agents. Advanced data tools allow unprecedented visibility in agents, offices, and markets for strategic planning and M&A support. Learn more at www.relitix.com.